Table of Contents >> Show >> Hide
- What Is Google Sheets and Why Beginners Like It
- Step 1: Open Google Sheets and Create Your First Spreadsheet
- Step 2: Learn the Google Sheets Interface (Without Falling Asleep)
- Step 3: Enter and Format Data Like a Human Spreadsheet Whisperer
- Step 4: Use Formulas (The Part That Looks Scary but Isn’t)
- Step 5: Sort, Filter, and Keep Your Data Under Control
- Step 6: Add Dropdowns and Conditional Formatting (Make Sheets Smarter)
- Step 7: Build Charts and Pivot Tables (Your Data’s Glow-Up)
- Step 8: Collaborate, Comment, and Protect Important Cells
- Step 9: Use Version History, Offline Mode, and Shortcuts
- Common Beginner Mistakes (and How to Avoid Them)
- A Simple Practice Project for Beginners
- Beginner Experiences With Google Sheets (500+ Words)
- Conclusion
If you’ve ever opened Google Sheets and immediately thought, “Cool… a giant grid of panic,” you are absolutely not alone. The good news: Google Sheets is one of the easiest spreadsheet tools to learn, especially if you take it one step at a time. You do not need to be a math wizard, an accountant, or the kind of person who says “pivot table” at parties.
This beginner-friendly guide walks you through the essentials: creating a sheet, entering data, using formulas, sorting and filtering, making charts, collaborating with others, and avoiding the classic mistakes that make people want to throw their laptop into the nearest pillow. By the end, you’ll be able to build a clean, useful spreadsheet for personal budgeting, school projects, content planning, inventory tracking, or pretty much any list-heavy part of life.
What Is Google Sheets and Why Beginners Like It
Google Sheets is Google’s web-based spreadsheet app. It runs in your browser, saves automatically, and makes collaboration ridiculously easy. That means you can start a spreadsheet on your laptop, open it later on your phone, and share it with someone else without emailing “Final_Version_Real_Final_v3.xlsx.”
For beginners, the biggest advantages are:
- Free to use with a Google account
- Auto-save so you don’t lose work
- Easy sharing for teamwork
- Built-in formulas and tools for calculations and analysis
- Works with Excel files if you need to import or export
Step 1: Open Google Sheets and Create Your First Spreadsheet
Create a blank spreadsheet
- Go to Google Sheets from your browser.
- Click Blank to create a new spreadsheet.
- Rename it at the top-left (for example: Monthly Budget or Content Calendar).
Start from a template (optional but helpful)
If blank pages make you nervous, templates are your best friend. Google Sheets offers templates for budgets, schedules, to-do lists, project trackers, and more. Templates are especially useful when you want a quick structure instead of building everything from scratch.
Import an Excel file
Already have a spreadsheet in Excel? No problem. Google Sheets can open and edit Excel files. This is great if a teacher, client, or coworker sends you an .xlsx file and you want to work in Sheets.
Step 2: Learn the Google Sheets Interface (Without Falling Asleep)
Before you start typing random numbers, it helps to know what you’re looking at.
The key parts of the screen
- Rows: Horizontal lines (numbered 1, 2, 3…)
- Columns: Vertical lines (labeled A, B, C…)
- Cells: Individual boxes where data lives (A1, B2, C3, etc.)
- Formula bar: Where you can view or edit the contents of a selected cell
- Toolbar: Quick actions like bold, colors, borders, and alignment
- Sheet tabs: Tabs at the bottom for multiple sheets in one file
Think of a spreadsheet like a super-organized notebook where every piece of information gets an address. If someone says “put that in cell C7,” they mean column C, row 7.
Step 3: Enter and Format Data Like a Human Spreadsheet Whisperer
Enter data
Click a cell and type. Press Enter to move down or Tab to move right. Start simple:
- Column A: Item names
- Column B: Category
- Column C: Price
- Column D: Date
Basic formatting
Formatting makes your sheet easier to read and less like a wall of chaos. Use the toolbar to:
- Bold headers
- Change font size
- Add borders
- Apply colors
- Align text
- Format numbers as currency, percentages, or dates
Resize rows and columns
If text gets cut off, drag the border between column letters (like A and B) to widen the column. You can also use text wrapping so long content appears neatly inside a cell.
Freeze header rows
When your sheet gets longer, scrolling can make headers disappear. Freezing keeps them visible.
Example: Freeze row 1 so your labels (Item, Category, Price, Date) stay at the top while you scroll.
Add more sheets
Click the + button near the bottom to add another sheet tab. This is useful for keeping related data together in one file, like:
- Sheet 1: Expenses
- Sheet 2: Income
- Sheet 3: Summary Dashboard
Step 4: Use Formulas (The Part That Looks Scary but Isn’t)
Formulas are what make spreadsheets powerful. A formula always starts with an = sign. Once you learn a few basics, you’ll feel like a productivity superhero.
Start with simple math
Here are beginner-friendly examples:
=C2+C3→ adds two cells=C2-C3→ subtracts=C2*C3→ multiplies=C2/C3→ divides
Use common functions
Functions are pre-built formulas. These are the “starter pack” functions you’ll use all the time:
=SUM(C2:C20)→ adds a range of numbers=AVERAGE(C2:C20)→ calculates the average=MIN(C2:C20)→ finds the lowest value=MAX(C2:C20)→ finds the highest value=COUNT(C2:C20)→ counts numeric cells
Try an IF formula (beginner logic)
IF formulas help you label or categorize data automatically.
Example: If a score in B2 is 70 or higher, mark it “Pass”; otherwise mark it “Fail.”
=IF(B2>=70,"Pass","Fail")
Understand cell references
Google Sheets uses cell references (like A1 or D7) so formulas can pull values from different cells. This is much better than typing numbers manually because your results update automatically when the data changes.
Pro tip for beginners: learn the difference between relative and absolute references later (A1 vs. $A$1). You don’t need it on day one, but it becomes very useful when copying formulas.
Step 5: Sort, Filter, and Keep Your Data Under Control
Once your spreadsheet has more than 20 rows, organization stops being optional.
Sort data
Sorting lets you arrange values alphabetically or numerically.
- Sort names from A to Z
- Sort prices from lowest to highest
- Sort dates from oldest to newest
This is perfect for cleaning up lists quickly, especially when your data starts looking like it was entered during a caffeine emergency.
Filter data
Filters let you display only the rows you want to see.
Example: Show only expenses in the “Food” category, or only tasks marked “In Progress.”
Filters are one of the most useful beginner features because they let you focus on one slice of your data without deleting anything.
Use filter views (great for shared sheets)
If you collaborate with others, filter views are incredibly helpful. They let you apply filters without changing what everyone else sees. In other words: no accidental “Who changed my sheet?!” moments.
Step 6: Add Dropdowns and Conditional Formatting (Make Sheets Smarter)
Create dropdown lists
Dropdowns make data entry faster and cleaner. Instead of typing “Done,” “done,” “DONE,” and “maybe done,” you choose from one list.
Use dropdowns for:
- Status (To Do, In Progress, Done)
- Priority (Low, Medium, High)
- Category (Food, Bills, Travel, Supplies)
Google Sheets lets you create dropdowns from manually entered options or from a range of cells. This is fantastic for consistency and reduces typos.
Use conditional formatting
Conditional formatting automatically changes cell appearance based on rules. This makes important data pop.
Examples:
- Highlight overdue dates in red
- Color “Done” tasks green
- Highlight duplicate values
- Flag scores below 80%
You can also use custom formulas in conditional formatting for more advanced highlighting. That sounds fancy, but even beginners can use it after a little practice.
Step 7: Build Charts and Pivot Tables (Your Data’s Glow-Up)
Create a chart
Charts help you visualize data instead of staring at numbers until they blur together.
- Select your data range
- Click Insert > Chart
- Choose a chart type (bar, column, line, pie, etc.)
- Customize titles, legends, and colors if needed
Example: Turn monthly expenses into a column chart to quickly see where your money actually went (spoiler: snacks are often more expensive than expected).
Create a pivot table
A pivot table summarizes large data sets without changing the original data. It sounds advanced, but Google Sheets makes it very approachable.
Example: If you track sales with columns for Date, Product, and Revenue, a pivot table can show total revenue by product in seconds.
Important beginner note: your source data should have clear column headers. Google Sheets uses those headers to build rows, columns, and values in the pivot table editor.
Step 8: Collaborate, Comment, and Protect Important Cells
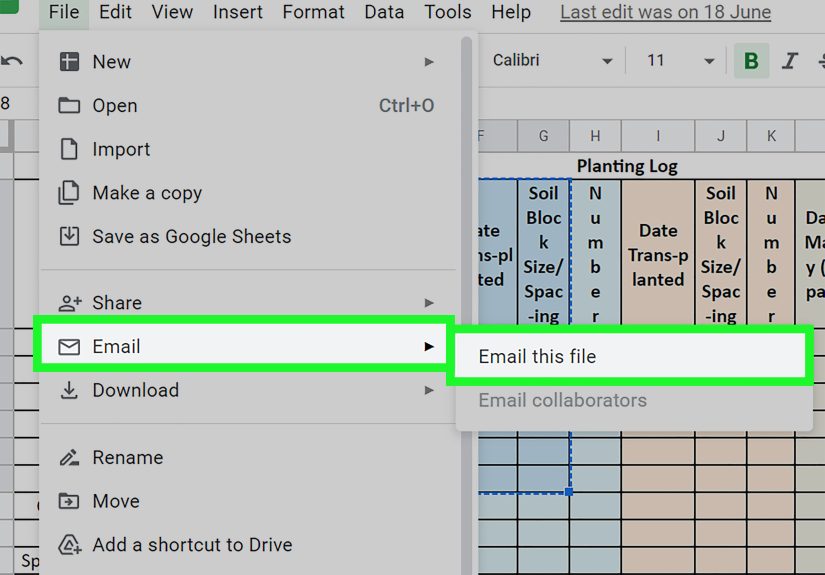
Share your spreadsheet
Click the Share button in the top-right corner. You can invite people by email and choose what they can do:
- Viewer: can only view
- Commenter: can comment but not edit
- Editor: can make changes
This makes Google Sheets perfect for team projects, class assignments, family budgets, and content calendars.
Use comments and action items
Comments are great for asking questions or leaving notes inside the sheet. You can also assign action items using @mentions so someone gets notified to handle a specific task.
Example: “@Alex Can you verify these numbers before Friday?”
Protect sheets and ranges
If multiple people edit the same file, protecting certain cells can save your sanity. You can lock a sheet or a specific range (like formulas) so people don’t accidentally overwrite it.
This is especially useful for:
- Budget summaries
- Formula columns
- Dashboards
- Shared team trackers
Step 9: Use Version History, Offline Mode, and Shortcuts
Version history (your undo button’s smarter cousin)
Version history lets you see past versions of a spreadsheet and restore an earlier one if needed. If something breaks, gets deleted, or looks suspiciously “creative,” version history can rescue your work.
You can also see who made changes, which is useful for teamwork and troubleshooting.
Work offline
Google Sheets is cloud-based, but you can enable offline access so you can keep working even without internet. This is handy for travel, unreliable Wi-Fi, or those mysterious coffee-shop internet blackouts.
Keyboard shortcuts (instant speed upgrade)
Shortcuts save time. A few beginner-friendly ones:
- Ctrl + C / Ctrl + V → Copy / Paste
- Ctrl + Z → Undo
- Ctrl + / → Open the keyboard shortcut list in Google Sheets
You don’t need to memorize everything at once. Learn 2–3 shortcuts, use them for a week, then add more.
Common Beginner Mistakes (and How to Avoid Them)
- Typing over formulas: Protect formula columns or label them clearly.
- No headers: Always create a header row before adding data.
- Mixing formats: Keep dates as dates, currency as currency, and numbers as numbers.
- Leaving blank rows in data tables: Blank rows can mess up sorting, filtering, and formulas.
- Over-formatting: Five font colors and neon backgrounds do not improve analytics (usually).
A Simple Practice Project for Beginners
If you want to learn Google Sheets fast, build something useful. Here’s a great starter project:
Monthly Expense Tracker
- Create columns: Date, Item, Category, Amount, Payment Method, Notes
- Add a dropdown for Category
- Format Amount as currency
- Use
=SUM()to total expenses - Add a filter to view spending by category
- Create a chart to visualize spending
- Try a pivot table to summarize totals by category
This one project teaches almost every beginner skill you need, and you’ll actually use it in real life.
Beginner Experiences With Google Sheets (500+ Words)
Most beginners have a surprisingly similar experience when they start using Google Sheets. Day one usually begins with confidence (“I can totally do this”), followed by mild confusion (“Why is the number moving?”), and ends with a weird amount of excitement after the first formula works. That learning curve is normal, and honestly, it’s part of the fun.
A common first win is building a simple list: groceries, homework tasks, a workout plan, or a content schedule. At that stage, Google Sheets feels like a neat digital notebook. Then the beginner discovers formatting. Suddenly, the sheet has bold headers, frozen top rows, and color-coded categories. It’s no longer “just a list.” It looks organized, which feels motivating. That visual progress matters because it gives beginners an early success before they ever touch formulas.
The next turning point is usually formulas. For many new users, typing =SUM(C2:C20) and watching a total appear feels like a magic trick. It’s a small moment, but it changes how they think about spreadsheets. They stop seeing Google Sheets as a place to store data and start seeing it as a tool that can do work for them. That shift is huge. Once a beginner realizes they can automate totals, averages, and status labels, they become much more curious and much less intimidated.
Another common experience is making “messy improvements.” Beginners often create a sheet that works, then realize it’s hard to read. So they rebuild it. Then they rebuild it again. This is not failureit’s exactly how spreadsheet skills grow. Every new version gets a little cleaner: better headers, fewer merged cells, more consistent formats, smarter dropdowns, and clearer naming. The best spreadsheet users are not born organized; they become organized through several rounds of “Why did I put the dates in three different formats?”
Collaboration is also where many people fall in love with Google Sheets. Students use it for group projects. Small teams use it for content calendars. Families use it for budgets or travel planning. The real-time editing and comments make people feel like they’re working together instead of passing files back and forth. Beginners are often surprised by how much easier this is compared to older spreadsheet habits, especially when version history saves them from accidental edits.
One challenge beginners frequently mention is knowing which feature to use when. Should this be a filter or a sort? A chart or a pivot table? A formula or a dropdown? That uncertainty is normal. The trick is to start simple and let your needs guide the tools. If you keep typing the same values, use a dropdown. If you can’t find rows quickly, use filters. If the numbers are hard to read, make a chart. If you want summaries, build a pivot table. Google Sheets becomes much easier when each feature solves a real problem you already have.
The most successful beginners treat Google Sheets like a skill, not a test. They practice on small projects, experiment freely, and expect mistakes. They click around. They undo things. They try again. That’s exactly the right approach. If you can create a basic tracker, use a few formulas, apply filters, and build one chart, you’re already past the hardest part. From there, everything else is just adding new tools to a toolkit you’ve already started using well.
Conclusion
Learning how to use Google Sheets as a beginner is less about memorizing every feature and more about mastering a few core skills: entering data, formatting it clearly, using simple formulas, sorting and filtering, and sharing your work. Once those basics are in place, tools like conditional formatting, charts, and pivot tables become much easier to understand.
Start with one practical spreadsheet you actually need. Keep it simple. Improve it a little each time. That’s how beginners become confident usersand how confident users eventually become the people everyone asks for spreadsheet help.