Table of Contents >> Show >> Hide
- What does it mean to “annualize” a percentage?
- A quick “choose your method” guide
- Way #1: Simple (linear) annualization multiply by periods
- Way #2: Compound annualization convert to an effective annual rate (EAR/APY style)
- Case A: You have a periodic rate (daily/weekly/monthly)
- Example 1: 2% per month (compounded)
- Example 2: 1.5% per quarter (compounded)
- Case B: You have a quoted nominal annual rate with a compounding frequency
- Example 3: Turning 4.65% APR into an effective annual yield
- Example 4: Daily compounding can change the story
- A business-metric example: Annualizing monthly churn
- When compound annualization is the right tool
- Common mistakes
- Way #3: Geometric annualization CAGR / annualized total return
- Practical checklist: Annualize without accidentally lying to yourself
- Common “annualization” questions (answered like a friendly spreadsheet)
- Conclusion
- Real-World Experiences: Annualizing Percentages Without Losing Your Mind
If you’ve ever stared at a “2% monthly” number and wondered, “Okay… but what is that in a year?”
congratulationsyou’ve discovered the ancient art of annualizing. It’s basically translation:
you’re converting a percentage from one time frame (day/week/month/quarter) into a yearly equivalent so you can
compare apples to apples… or at least apples to a very organized calendar.
The trick is that there isn’t just one “correct” annualization method. The right method depends on what your
percentage represents (interest rate vs. investment return vs. growth rate vs. churn) and whether compounding is
part of the story. Below are three practical, widely used ways to annualize a percentageplus
examples, common mistakes, and a short sanity checklist.
What does it mean to “annualize” a percentage?
To annualize a percentage means to express a rate or return as if it applied over a full year.
You might annualize:
- Interest (monthly interest on a loan, daily interest on a credit card)
- Investment returns (a 6-month portfolio return you want to compare to 1-year returns)
- Business metrics (monthly churn, weekly conversion rates, quarterly growth)
Annualizing helps you compare numbers across different time windowsbut it can also mislead if you choose the
wrong method or ignore seasonality, volatility, or one-off events. (Yes, your “annualized” 7-day return during a
meme-stock week is basically a financial jump scare.)
A quick “choose your method” guide
| Method | Best for | Core idea | Watch out for |
|---|---|---|---|
| 1) Simple (linear) | Short-term rates with no compounding assumption, quick estimates, some APR-style disclosures | Scale up by the number of periods in a year | Over/understates when compounding is meaningful |
| 2) Compound (effective annual) | Interest with compounding, reinvested returns, churn/retention | “Repeat this period over and over for a year” | Requires the correct period count (12, 52, 365, etc.) |
| 3) Geometric (CAGR / annualized return) | Multi-period investment performance, growth over multiple years | Geometric average growth per year | Ignores the path/volatility; assumes smooth annual equivalent |
Way #1: Simple (linear) annualization multiply by periods
Simple annualization is the “napkin math” method: take a periodic percentage and multiply it by how many of those
periods fit into a year. It’s fast, it’s easy, and it’s sometimes exactly what you wantespecially for small
rates or when compounding isn’t actually applied.
The formula
If rp is the periodic rate (as a decimal) and m is the number of
periods per year:
Annualized (simple) ≈ rp × m
Common m values: monthly = 12, weekly = 52, daily = 365, quarterly = 4.
Example 1: Monthly rate
Say you have 2% per month.
- Monthly rate: 2% = 0.02
- Simple annualized: 0.02 × 12 = 0.24 = 24%
So the simple annualized rate is 24%. That’s clean. That’s tidy. That’s also not compounded.
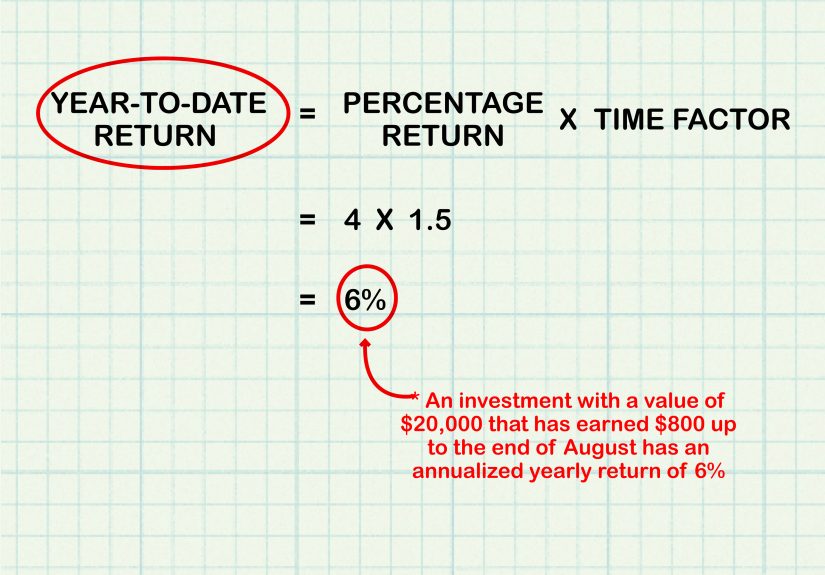
Example 2: Quarterly rate
If a metric grows 1.5% per quarter:
- 0.015 × 4 = 0.06 = 6% simple annualized
When simple annualization works best
- Very small rates where compounding barely changes the answer (e.g., 0.05% weekly).
- Disclosure-style rates where the convention is explicitly linear (common in “APR-ish” contexts).
- Quick comparisons when you just need a rough annual scale and you’ll refine later.
Common mistakes
- Using simple math for something that compounds (like savings APY, reinvested returns, or churn).
- Using the wrong period count (a “monthly” metric based on 28 days isn’t truly monthly; calendars are messy).
- Annualizing seasonal data (a holiday spike does not deserve to be multiplied into eternity).
Way #2: Compound annualization convert to an effective annual rate (EAR/APY style)
If the percentage you’re annualizing compoundsmeaning each period builds on the lastthen you
want compound annualization. This is the logic behind effective annual rate (EAR) and annual percentage yield (APY):
it reflects what happens when the periodic rate repeats throughout the year and compounds each time.
Case A: You have a periodic rate (daily/weekly/monthly)
If rp is the periodic rate and m is the number of periods per year:
Annualized (compound) = (1 + rp)m − 1
Example 1: 2% per month (compounded)
Same monthly rate as before: 2% per month (0.02), but now assume compounding:
- Compound annualized = (1.02)12 − 1 ≈ 26.82%
- Simple annualized was 24%
The difference (about 2.82 percentage points) is compounding doing what compounding does:
quietly adding weight over time like a raccoon dragging snacks back to its lair.
Example 2: 1.5% per quarter (compounded)
- Compound annualized = (1.015)4 − 1 ≈ 6.14%
- Simple annualized = 6%
Case B: You have a quoted nominal annual rate with a compounding frequency
Sometimes you’re given a “nominal” annual rate (often labeled like an APR) and told it compounds monthly/daily.
A common conversion to an effective annual rate is:
Effective annual = (1 + (rnominal / m))m − 1
Example 3: Turning 4.65% APR into an effective annual yield
Suppose a deposit product advertises 4.65% APR with monthly compounding:
- Effective annual ≈ (1 + 0.0465/12)12 − 1 ≈ 4.75%
That effective number is the “real” one-year result under monthly compounding (what many people think they’re
getting when they hear “4.65%”).
Example 4: Daily compounding can change the story
If a credit product effectively compounds daily, an 18% nominal annual rate can translate to an
effective annual rate around:
- (1 + 0.18/365)365 − 1 ≈ 19.72%
The exact mechanics depend on the product and how interest is applied, but the core lesson holds:
compounding frequency matters.
A business-metric example: Annualizing monthly churn
Compounding isn’t just for finance. It shows up anytime a percentage repeats on a base that changes each period.
Monthly churn is a classic example.
If monthly churn is 3%, monthly retention is 97%. Annual retention is:
- Annual retention = 0.9712 ≈ 69.38%
- Annual churn = 1 − 0.9712 ≈ 30.62%
Notice how 3% × 12 = 36% is not the same as compounding churn. The compounding version is usually
the more meaningful business interpretation.
When compound annualization is the right tool
- APY/EAR conversions (savings, CDs, anything that compounds interest)
- Reinvested investment returns (you care about growth of wealth, not just additive rates)
- Repeatable operational rates (churn, retention, defect rates, conversion funnels)
Common mistakes
- Mixing nominal and effective rates (APR and APY are not interchangeable)
- Annualizing a “one-off” period as if it repeats 12 times (sometimes that’s forecasting, not annualizing)
- Using 365 when the metric is based on trading days (markets often use ~252 trading days for daily returns)
Way #3: Geometric annualization CAGR / annualized total return
If you’re annualizing performance over multiple periodsespecially yearsthe cleanest, most widely
used concept is the geometric average annual return, often expressed as CAGR
(compound annual growth rate) or “annualized return.”
Why geometric? Because investment and growth processes multiply over time. If you gain 10% and then lose 10%,
you’re not “back to zero” (you’re down 1%). The geometric approach respects that math.
Formula 1: CAGR from beginning and ending values
If you have a beginning value BV, ending value EV, and a holding period of
t years:
CAGR = (EV / BV)(1 / t) − 1
Example 1: A 3.5-year growth story
You invest $10,000 and it becomes $12,500 in 3.5 years.
- EV/BV = 12,500 / 10,000 = 1.25
- CAGR = 1.25(1/3.5) − 1 ≈ 6.58% per year
That means “a smooth 6.58% per year” would land you at the same ending valuewithout pretending the ride was
actually smooth (it probably wasn’t).
Formula 2: Annualizing a chain of periodic returns
If you have periodic returns r1, r2, …, rn, you can compound them and scale to a year.
For example, if the returns cover k months total:
Annualized = ( (1 + r1) × (1 + r2) × … × (1 + rn) )(12 / k) − 1
Example 2: Three monthly returns
Suppose you have three monthly returns: +5%, −3%, +2%. First combine them:
- Growth factor = 1.05 × 0.97 × 1.02 = 1.03887 (about +3.887% over 3 months)
- Annualized = 1.03887(12/3) − 1 ≈ 16.48%
This does not claim you will earn 16.48% next year. It simply expresses the observed three-month
performance in an annual equivalent way.
Example 3: Annualizing a non-integer time window (90 days)
If you have a 90-day return of 4%, and you want the annual equivalent using calendar days:
- Annualized = (1.04)(365/90) − 1 ≈ 17.24%
Again: it’s a translation, not a prophecy.
When CAGR-style annualization is the right tool
- Performance reporting over multiple years
- Comparing investments held for different lengths of time
- Summarizing growth when you want one “per-year” number that matches the start-to-end result
Common mistakes
- Confusing annualized return with average yearly return (arithmetic averages can be misleading).
- Ignoring volatility: CAGR tells you the destination, not how bumpy the road was.
- Using CAGR for metrics with strong seasonality without context (some businesses live and die by Q4).
Practical checklist: Annualize without accidentally lying to yourself
- Step 1: Identify what your percentage represents: interest rate, return, growth, churn, conversion, etc.
- Step 2: Decide whether repeating the period implies compounding. If yes, use a compound method.
- Step 3: Match the period count to your data (12 months, 52 weeks, 365 days, or industry-specific conventions like trading days).
- Step 4: If your window spans multiple periods, consider a geometric/CAGR approach.
- Step 5: Add context: annualized numbers from short windows are fragile and should be labeled clearly.
Common “annualization” questions (answered like a friendly spreadsheet)
Is multiplying by 12 always wrong?
Not always. It’s a legitimate convention in some contexts, and it’s a decent approximation for small rates.
But if compounding is part of the product or the process, multiplying is usually incomplete.
Why do APY and APR differ?
In plain English: APR is often presented as a simpler annualized rate, while APY
reflects compounding. If compounding happens more than once a year, APY can be higher than APR for deposit products.
Can I annualize “percent of something” like a conversion rate?
Yes, but be careful. If it’s a rate applied to a changing base (like retention), compounding logic often fits.
If it’s a simple ratio (like “this month, 8% of visitors converted”), annualizing may be more like forecasting
than mathematical conversionso label it honestly.
Conclusion
Annualizing a percentage is less about memorizing one magic formula and more about matching the math to the
real-world meaning of the metric. Use simple annualization for quick scaling, use
compound annualization when compounding is real, and use CAGR/geometric annualization
when you’re summarizing multi-period performance.
And if someone hands you a 7-day return and a straight face and asks for an annualized number, you can do it
just remember to add a footnote that says “this assumes the universe repeats itself every week,” which historically
has not been its strongest habit.
Real-World Experiences: Annualizing Percentages Without Losing Your Mind
In real projects, the hardest part of annualizing isn’t the formulait’s the conversation.
Someone wants one clean number for a slide deck, another person wants precision down to the last basis point,
and a third person is quietly trying to annualize a metric that shouldn’t be annualized at all. (That third
person is often the loudest, too.)
A common experience in marketing analytics is the “weekly conversion rate dilemma.” A team sees a 0.8% conversion
rate over one week and asks, “So what’s the annual conversion rate?” If conversions are independent events per
visitor, there isn’t a simple “annual conversion rate” unless you define the exposure: how many visitors per week,
how the mix changes, whether repeat visitors behave differently, and whether the campaign calendar stays stable.
Annualizing here can shift from math to modeling. The best practice is to annualize volume drivers
(traffic, spend, leads) and keep conversion rates in the time frame where they’re measured, unless you’re running
a true forecast model.
In SaaS and subscription businesses, annualizing shows up constantly with churn and retention. Leaders love a single
“annual churn” number because it’s easy to compare across companies. But the experience many teams run into is that
churn is rarely stationary: onboarding improvements, pricing changes, and product releases can all shift churn by
cohort. The compounding method (1 − retention12) is useful, but only if you’re honest about what it is:
a translation of a monthly rate into a yearly equivalent under repetition. Smart teams pair annualized churn with
cohort charts so decision-makers can see whether churn is improving or if the “annualized” number is masking a
trend.
In investing and personal finance, one of the most frequent real-world hiccups is mixing up APR and APY. People
will compare a savings account APY to a loan APR and assume they’re apples-to-apples. They’re not always. The habit
that helps most is to ask a simple question: “Does this number already include compounding?”
If yes, treat it like an effective annual measure. If no, you may need to convert. This is why bank products often
emphasize APY for deposits: it communicates the one-year impact of compounding in a consumer-friendly way.
Analysts in corporate settings often annualize partial-year performance for KPIs like revenue growth or margin
changes. The experience here is that simple annualization (multiply by 4 for quarterly growth) can be tempting,
especially under deadline pressure. But compounding can be more realistic for growth metricsuntil seasonality
enters. Retail businesses, travel companies, and many consumer brands do not behave like smooth compounding machines.
Annualizing Q4 performance is basically asking a snowstorm to summarize July.
Finally, a “quiet” experience many finance teams share: annualization can become a shortcut that hides risk.
Two investments can have the same annualized return but wildly different paths. That’s why professionals often
present annualized returns alongside volatility, drawdowns, or ranges of outcomes. Annualizing is a powerful tool
but it’s not a complete story. If you treat it as a translation (not a prediction), you’ll use it well. If you treat
it as a guarantee, it will eventually prank you in public.